


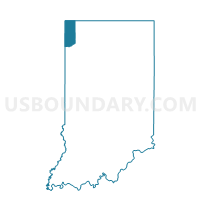
Census Tract 423, Lake County, Indiana
About
Outline

Summary
| Unique Area Identifier | 456558 |
| Name | Census Tract 423 |
| County | Lake County |
| State | Indiana |
| Area (square miles) | 26.46 |
| Land Area (square miles) | 26.45 |
| Water Area (square miles) | 0.01 |
| % of Land Area | 99.96 |
| % of Water Area | 0.04 |
| Latitude of the Internal Point | 41.46903900 |
| Longtitude of the Internal Point | -87.26819680 |
| Total Population | 7,248 |
| Total Housing Units | 3,198 |
| Total Households | 2,989 |
| Median Age | 38.7 |
Maps

Graphs
Select a template below for downloading or customizing gragh for Census Tract 423, Lake County, Indiana


Neighbors
Neighoring Census Tract (by Name) Neighboring Census Tract on the Map
- Census Tract 420, Lake County, IN
- Census Tract 422, Lake County, IN
- Census Tract 424.02, Lake County, IN
- Census Tract 424.03, Lake County, IN
- Census Tract 425.03, Lake County, IN
- Census Tract 425.04, Lake County, IN
- Census Tract 425.05, Lake County, IN
- Census Tract 432.02, Lake County, IN
- Census Tract 433, Lake County, IN
- Census Tract 510.05, Porter County, IN
- Census Tract 510.06, Porter County, IN
- Census Tract 510.07, Porter County, IN
Top 10 Neighboring County Subdivision (by Population) Neighboring County Subdivision on the Map
- Ross township, Lake County, IN (47,890)
- Hobart township, Lake County, IN (39,417)
- Center township, Lake County, IN (31,756)
- Winfield township, Lake County, IN (10,054)
- Porter township, Porter County, IN (9,367)
- Union township, Porter County, IN (8,811)
Top 10 Neighboring Place (by Population) Neighboring Place on the Map
- Merrillville town, IN (35,246)
- Hobart city, IN (29,059)
- Crown Point city, IN (27,317)
- Winfield town, IN (4,383)
Top 10 Neighboring Unified School District (by Population) Neighboring Unified School District on the Map
- Merrillville Community School, IN (47,642)
- Crown Point Community School Corporation, IN (41,810)
- Hobart School City, IN (23,679)
- Porter Township School Corporation, IN (9,367)
- Union Township School Corporation, IN (8,811)
Top 10 Neighboring State Legislative District Lower Chamber (by Population) Neighboring State Legislative District Lower Chamber on the Map
- State House District 4, IN (74,588)
- State House District 19, IN (72,438)
- State House District 13, IN (70,000)
Top 10 Neighboring State Legislative District Upper Chamber (by Population) Neighboring State Legislative District Upper Chamber on the Map
- State Senate District 6, IN (146,652)
- State Senate District 4, IN (141,328)
- State Senate District 2, IN (109,233)
- State Senate District 3, IN (103,290)
Top 10 Neighboring 111th Congressional District (by Population) Neighboring 111th Congressional District on the Map
Top 10 Neighboring 5-Digit ZIP Code Tabulation Area (by Population) Neighboring 5-Digit ZIP Code Tabulation Area on the Map
Explore Neighbors on the MapData
Demographic, Population, Households, and Housing Units
** Data sources from census 2010 **
Show Data on Map
Download Full List as CSV
Download Quick Sheet as CSV
| Subject | This Area | Lake County | Indiana | National |
|---|---|---|---|---|
| POPULATION | ||||
| Total Population Map | 7,248 | 496,005 | 6,483,802 | 308,745,538 |
| POPULATION, HISPANIC OR LATINO ORIGIN | ||||
| Not Hispanic or Latino Map | 6,246 | 413,342 | 6,094,095 | 258,267,944 |
| Hispanic or Latino Map | 1,002 | 82,663 | 389,707 | 50,477,594 |
| POPULATION, RACE | ||||
| White alone Map | 5,308 | 319,412 | 5,467,906 | 223,553,265 |
| Black or African American alone Map | 1,232 | 128,263 | 591,397 | 38,929,319 |
| American Indian and Alaska Native alone Map | 28 | 1,628 | 18,462 | 2,932,248 |
| Asian alone Map | 155 | 6,142 | 102,474 | 14,674,252 |
| Native Hawaiian and Other Pacific Islander alone Map | 2 | 108 | 2,348 | 540,013 |
| Some Other Race alone Map | 322 | 28,792 | 173,314 | 19,107,368 |
| Two or More Races Map | 201 | 11,660 | 127,901 | 9,009,073 |
| POPULATION, SEX | ||||
| Male Map | 3,583 | 239,383 | 3,189,737 | 151,781,326 |
| Female Map | 3,665 | 256,622 | 3,294,065 | 156,964,212 |
| POPULATION, AGE (18 YEARS) | ||||
| 18 years and over Map | 5,733 | 368,732 | 4,875,504 | 234,564,071 |
| Under 18 years | 1,515 | 127,273 | 1,608,298 | 74,181,467 |
| POPULATION, AGE | ||||
| Under 5 years | 410 | 33,258 | 434,075 | 20,201,362 |
| 5 to 9 years | 452 | 35,119 | 444,821 | 20,348,657 |
| 10 to 14 years | 401 | 36,356 | 452,171 | 20,677,194 |
| 15 to 17 years | 252 | 22,540 | 277,231 | 12,954,254 |
| 18 and 19 years | 161 | 13,860 | 198,284 | 9,086,089 |
| 20 years | 78 | 6,242 | 98,994 | 4,519,129 |
| 21 years | 81 | 5,682 | 94,313 | 4,354,294 |
| 22 to 24 years | 292 | 17,422 | 258,719 | 12,712,576 |
| 25 to 29 years | 557 | 31,654 | 419,530 | 21,101,849 |
| 30 to 34 years | 530 | 31,169 | 407,815 | 19,962,099 |
| 35 to 39 years | 536 | 31,074 | 417,011 | 20,179,642 |
| 40 to 44 years | 485 | 31,556 | 423,819 | 20,890,964 |
| 45 to 49 years | 460 | 35,797 | 473,946 | 22,708,591 |
| 50 to 54 years | 579 | 38,044 | 472,822 | 22,298,125 |
| 55 to 59 years | 554 | 33,334 | 418,515 | 19,664,805 |
| 60 and 61 years | 171 | 11,827 | 150,022 | 7,113,727 |
| 62 to 64 years | 224 | 15,201 | 200,606 | 9,704,197 |
| 65 and 66 years | 143 | 8,045 | 109,710 | 5,319,902 |
| 67 to 69 years | 227 | 11,499 | 149,347 | 7,115,361 |
| 70 to 74 years | 246 | 14,887 | 193,278 | 9,278,166 |
| 75 to 79 years | 207 | 12,275 | 151,843 | 7,317,795 |
| 80 to 84 years | 113 | 10,097 | 121,658 | 5,743,327 |
| 85 years and over | 89 | 9,067 | 115,272 | 5,493,433 |
| MEDIAN AGE BY SEX | ||||
| Both sexes Map | 38.70 | 37.40 | 37.00 | 37.20 |
| Male Map | 37.70 | 35.90 | 35.70 | 35.80 |
| Female Map | 39.80 | 38.80 | 38.20 | 38.50 |
| HOUSEHOLDS | ||||
| Total Households Map | 2,989 | 188,157 | 2,502,154 | 116,716,292 |
| HOUSEHOLDS, HOUSEHOLD TYPE | ||||
| Family households: Map | 1,948 | 127,647 | 1,674,126 | 77,538,296 |
| Husband-wife family Map | 1,531 | 84,049 | 1,241,267 | 56,510,377 |
| Other family: Map | 417 | 43,598 | 432,859 | 21,027,919 |
| Male householder, no wife present Map | 134 | 10,792 | 122,677 | 5,777,570 |
| Female householder, no husband present Map | 283 | 32,806 | 310,182 | 15,250,349 |
| Nonfamily households: Map | 1,041 | 60,510 | 828,028 | 39,177,996 |
| Householder living alone Map | 860 | 51,612 | 671,920 | 31,204,909 |
| Householder not living alone Map | 181 | 8,898 | 156,108 | 7,973,087 |
| HOUSEHOLDS, HISPANIC OR LATINO ORIGIN OF HOUSEHOLDER | ||||
| Not Hispanic or Latino householder: Map | 2,697 | 164,951 | 2,403,018 | 103,254,926 |
| Hispanic or Latino householder: Map | 292 | 23,206 | 99,136 | 13,461,366 |
| HOUSEHOLDS, RACE OF HOUSEHOLDER | ||||
| Householder who is White alone | 2,260 | 126,384 | 2,171,176 | 89,754,352 |
| Householder who is Black or African American alone | 505 | 48,576 | 220,246 | 14,129,983 |
| Householder who is American Indian and Alaska Native alone | 9 | 539 | 6,912 | 939,707 |
| Householder who is Asian alone | 65 | 1,896 | 32,567 | 4,632,164 |
| Householder who is Native Hawaiian and Other Pacific Islander alone | 1 | 33 | 688 | 143,932 |
| Householder who is Some Other Race alone | 98 | 8,210 | 43,842 | 4,916,427 |
| Householder who is Two or More Races | 51 | 2,519 | 26,723 | 2,199,727 |
| HOUSEHOLDS, HOUSEHOLD TYPE BY HOUSEHOLD SIZE | ||||
| Family households: Map | 1,948 | 127,647 | 1,674,126 | 77,538,296 |
| 2-person household Map | 910 | 50,186 | 729,444 | 31,882,616 |
| 3-person household Map | 423 | 30,481 | 378,922 | 17,765,829 |
| 4-person household Map | 352 | 24,844 | 318,738 | 15,214,075 |
| 5-person household Map | 161 | 12,856 | 153,042 | 7,411,997 |
| 6-person household Map | 59 | 5,381 | 58,414 | 3,026,278 |
| 7-or-more-person household Map | 43 | 3,899 | 35,566 | 2,237,501 |
| Nonfamily households: Map | 1,041 | 60,510 | 828,028 | 39,177,996 |
| 1-person household Map | 860 | 51,612 | 671,920 | 31,204,909 |
| 2-person household Map | 169 | 7,698 | 124,749 | 6,360,012 |
| 3-person household Map | 7 | 815 | 19,544 | 992,156 |
| 4-person household Map | 1 | 262 | 8,255 | 411,171 |
| 5-person household Map | 2 | 70 | 2,393 | 126,634 |
| 6-person household Map | 1 | 30 | 737 | 48,421 |
| 7-or-more-person household Map | 1 | 23 | 430 | 34,693 |
| HOUSING UNITS | ||||
| Total Housing Units Map | 3,198 | 208,750 | 2,795,541 | 131,704,730 |
| HOUSING UNITS, OCCUPANCY STATUS | ||||
| Occupied Map | 2,989 | 188,157 | 2,502,154 | 116,716,292 |
| Vacant Map | 209 | 20,593 | 293,387 | 14,988,438 |
| HOUSING UNITS, OCCUPIED, TENURE | ||||
| Owned with a mortgage or a loan Map | 1,568 | 94,655 | 1,259,825 | 52,979,430 |
| Owned free and clear Map | 486 | 35,805 | 488,150 | 23,006,644 |
| Renter occupied Map | 935 | 57,697 | 754,179 | 40,730,218 |
| HOUSING UNITS, VACANT, VACANCY STATUS | ||||
| For rent Map | 66 | 6,284 | 93,029 | 4,137,567 |
| Rented, not occupied Map | 0 | 230 | 3,859 | 206,825 |
| For sale only Map | 61 | 3,032 | 46,410 | 1,896,796 |
| Sold, not occupied Map | 9 | 593 | 10,862 | 421,032 |
| For seasonal, recreational, or occasional use Map | 25 | 819 | 45,571 | 4,649,298 |
| For migrant workers Map | 0 | 23 | 200 | 24,161 |
| Other vacant Map | 48 | 9,612 | 93,456 | 3,652,759 |
| HOUSING UNITS, OCCUPIED, AVERAGE HOUSEHOLD SIZE BY TENURE | ||||
| Total: Map | 2.42 | 2.60 | 2.52 | 2.58 |
| Owner occupied Map | 2.65 | 2.67 | 2.60 | 2.65 |
| Renter occupied Map | 1.90 | 2.46 | 2.33 | 2.44 |
| HOUSING UNITS, OCCUPIED, TENURE BY RACE OF HOUSEHOLDER | ||||
| Owner occupied: Map | 2,054 | 130,460 | 1,747,975 | 75,986,074 |
| Householder who is White alone Map | 1,727 | 100,965 | 1,604,197 | 63,446,275 |
| Householder who is Black or African American alone Map | 206 | 21,334 | 89,346 | 6,261,464 |
| Householder who is American Indian and Alaska Native alone Map | 6 | 320 | 3,927 | 509,588 |
| Householder who is Asian alone Map | 19 | 1,326 | 16,499 | 2,688,861 |
| Householder who is Native Hawaiian and Other Pacific Islander alone Map | 1 | 20 | 363 | 61,911 |
| Householder who is Some Other Race alone Map | 70 | 5,081 | 20,395 | 1,975,817 |
| Householder who is Two or More Races Map | 25 | 1,414 | 13,248 | 1,042,158 |
| Renter occupied: Map | 935 | 57,697 | 754,179 | 40,730,218 |
| Householder who is White alone Map | 533 | 25,419 | 566,979 | 26,308,077 |
| Householder who is Black or African American alone Map | 299 | 27,242 | 130,900 | 7,868,519 |
| Householder who is American Indian and Alaska Native alone Map | 3 | 219 | 2,985 | 430,119 |
| Householder who is Asian alone Map | 46 | 570 | 16,068 | 1,943,303 |
| Householder who is Native Hawaiian and Other Pacific Islander alone Map | 0 | 13 | 325 | 82,021 |
| Householder who is Some Other Race alone Map | 28 | 3,129 | 23,447 | 2,940,610 |
| Householder who is Two or More Races Map | 26 | 1,105 | 13,475 | 1,157,569 |
| HOUSING UNITS, OCCUPIED, TENURE BY HISPANIC OR LATINO ORIGIN OF HOUSEHOLDER | ||||
| Owner occupied: Map | 2,054 | 130,460 | 1,747,975 | 75,986,074 |
| Not Hispanic or Latino householder Map | 1,842 | 115,232 | 1,696,271 | 69,617,625 |
| Hispanic or Latino householder Map | 212 | 15,228 | 51,704 | 6,368,449 |
| Renter occupied: Map | 935 | 57,697 | 754,179 | 40,730,218 |
| Not Hispanic or Latino householder Map | 855 | 49,719 | 706,747 | 33,637,301 |
| Hispanic or Latino householder Map | 80 | 7,978 | 47,432 | 7,092,917 |
| HOUSING UNITS, OCCUPIED, TENURE BY HOUSEHOLD SIZE | ||||
| Owner occupied: Map | 2,054 | 130,460 | 1,747,975 | 75,986,074 |
| 1-person household Map | 400 | 30,207 | 379,164 | 16,453,569 |
| 2-person household Map | 804 | 43,763 | 659,731 | 27,618,605 |
| 3-person household Map | 331 | 22,256 | 283,901 | 12,517,563 |
| 4-person household Map | 288 | 18,643 | 245,272 | 10,998,793 |
| 5-person household Map | 142 | 9,310 | 113,305 | 5,057,765 |
| 6-person household Map | 55 | 3,764 | 41,703 | 1,965,796 |
| 7-or-more-person household Map | 34 | 2,517 | 24,899 | 1,373,983 |
| Renter occupied: Map | 935 | 57,697 | 754,179 | 40,730,218 |
| 1-person household Map | 460 | 21,405 | 292,756 | 14,751,340 |
| 2-person household Map | 275 | 14,121 | 194,462 | 10,624,023 |
| 3-person household Map | 99 | 9,040 | 114,565 | 6,240,422 |
| 4-person household Map | 65 | 6,463 | 81,721 | 4,626,453 |
| 5-person household Map | 21 | 3,616 | 42,130 | 2,480,866 |
| 6-person household Map | 5 | 1,647 | 17,448 | 1,108,903 |
| 7-or-more-person household Map | 10 | 1,405 | 11,097 | 898,211 |
Loading...